


Day 6: Launching the Learning Community
| Name: Dr. Lisa O'Neill Area/Discipline: Faculty Development/Education Twitter handle: @capermags |

The Technique
Both my master’s and my doctorate were (primarily) delivered online. I have, as a learner over the last 20 years, experienced the full gamut of community-building techniques recommended for online learning. As an instructor, I try to model the most practical community-building ones for my learners, though I try to do so in more novel ways.
In the course I teach, Designing Distributed Learning, I have many “things” that I really enjoy doing for and with my learners. I wish my learners responded well to all my techniques (especially the ones I spend excessive amounts of time on lol), but the one they respond to most favorably every term is the “introduce yourself post” activity I do during the first days of the course. Each learner is asked to do this as their first task in the course and, while this is one of the most traditional online teaching/learning techniques out there, it is what I do with the data that repurposes it into the learning-community launch technique I want to share here.
Online learning can feel isolating. Learners can feel like they are going it alone and, as a major assumption learners often put in front of their journey, this feeling can persist unless the story changes. My community-building technique addresses this assumption early in the course by showing learners the areas of overlap between their experiences and those of their peer learners. This small activity shows them a much more accurate view of the learning community they are part of and can be inspired by.
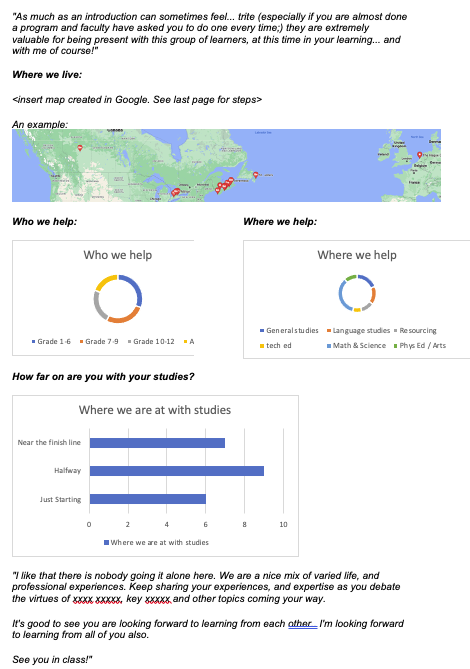
After consolidating all introductions, the resulting community-launch post looks something like this:
How I Use It
As a first task in my course, I ask learners to share where they live, what subject and/or which grades they teach, and how far along they are in their studies. My review of all responses (shared to the course’s online “student lounge”) allows me to analyze all introductions so that I can help my learners take something that, by now, they are tired of doing (introduce yourself posts) and make it new again. I try to share my consolidation post by the end of the first week at the latest, but finding the patterns in the data does not take much time, so timing is not a problem.
Step by step
- To do my analysis, I download all the responses and collate them into a table which sorts the information I am asking them to share.
- Once I have all the introduction posts sorted, I do a count of clusters.
- I use my count (e.g., five learners teach grades 4-6, six teach grades 10-12, four teach mathematics, etc.) to update the pie charts and bar graphs I have embedded in the community-launch document I’ve created. I’ve linked the document as a template* in case you want to try it out.**
- Once this step is done, I can save each chart as an image to include in my community-launch post.
- The final step is to take the data from the “where do you live” column and create a Google map with a pin at each location where a learner lives. I create one map per course. Once done, I save this as an image also.
- Once all my images are ready, I can tell a story about who we are shaping up to be as a group as an introduction to our learning community.
* Creating the template has made this process quite quick. I open the file, double click on each graph (which opens Excel), and enter my count(s). Once Excel is closed, the image is updated. You might ask different questions specific to your discipline, and your clusters will be different for your program’s “learner profiles,” but your story will be similar. You have a diverse group of learners who need to be reminded that they are not alone in their learning journey.
** The linked file is a template. Download it and, when you open it the first time, it will create a new document. I keep one file for each term and, at some point, I’ll go through the last five years to do a meta analysis – or, at least, I could.
Feedback from Learners
“I appreciate your response to our introductions because, as you said, they do tend to get a bit repetitive and lose value after a few courses. You certainly showed me the value of the activity, and I appreciate the presentation of the information.”
“This is the best use of introduction information I have seen yet! I don't mind posting about myself (seventh course, this is old hat), but I feel like that is lost to the ether when you are doing a course online. I like this breakdown! It's neat to see who we are as a collective. Thank you for putting that together.”
“Thanks for posting this. What a neat way to look at the class dynamics. :)”
“I love that you took the time to lay our data out in this way. Thank you. We are definitely varied on some levels, yet we are here for a common goal.”
One Final Task
Is this something you can use in your classroom? How might you utilize it? If you share your results somewhere on social media, please let us know by using the hashtag #12tech22LUDay6.

![]()
12 Techniques of the Holidays 2022 by Teaching Commons@LU is licensed under a Creative Commons Attribution-NonCommercial-ShareAlike 4.0 International License.